Bitcoin sees Bollinger Bands 'head fake' with $117K bulls' next target
Cointelegraph
Aug 07, 2025 22:59:34


Key points:
Bitcoin bulls keep momentum intact at the Wall Street open, with $117,000 and higher on the radar.
Order-book liquidity shows shorts getting liquidated, with fresh liquidity being added higher.
Bitcoin conforms to key Bollinger Bands levels, producing another fake breakdown this month.
Bitcoin delivered a textbook rebound move Thursday as BTC price stayed pinned by key resistance levels.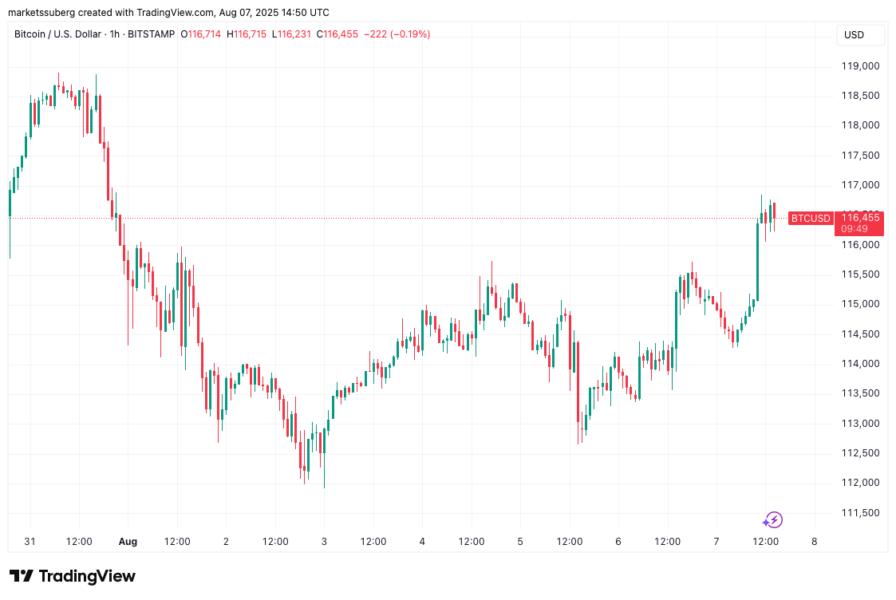
Bitcoin shorts pay as price hits new August high
Data from Cointelegraph Markets Pro and TradingView showed nearing $117,000 before cooling off.
The Wall Street open preserved bullish momentum, and market participants dug in to see how BTC price action would play out.
For popular trader and analyst Rekt Capital, $17,200 was crucial.
#BTC
Slowly but surely, Bitcoin is getting closer to finding out
Potential for reversal from an Ascending Triangle-like formation first discussed on the Elite Live Weekly Strategy Call this past Tuesday
Become Elite here:https://t.co/CWLXYsY4t2$BTC #Crypto #Bitcoin https://t.co/I5sEADbwga pic.twitter.com/VWEwDyHagi
Fellow trader CrypNuevo noted that upside liquidity on exchange order books had been taken with the visit beyond $116,800.
“This is the way the market moves - always around and towards the liquidity. Market structure for context and MM footprints for signs,” he told X followers, suggesting that $119,000 could come “next.”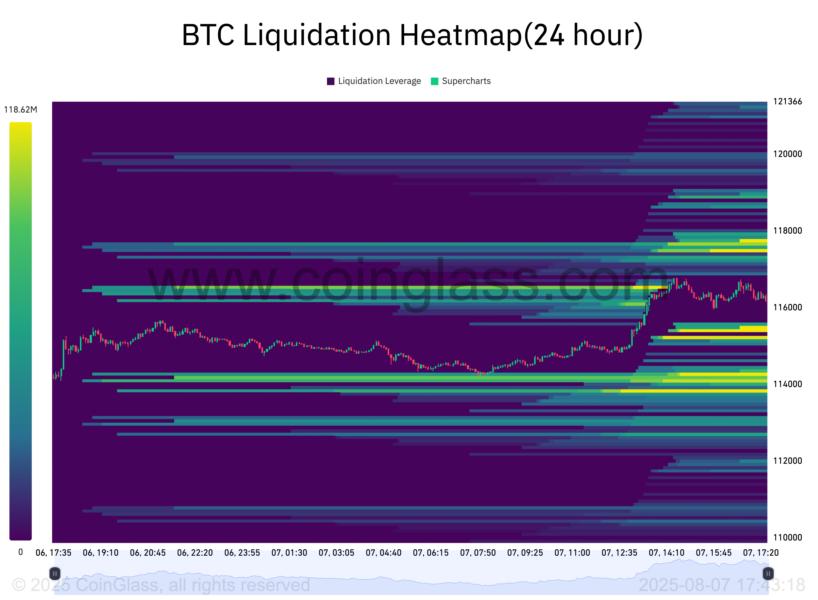
Data from monitoring resource CoinGlass showed resistance now thickening between $117,500 and $118,000.
Bids meanwhile extended all the way to below $114,000, surrounding a now-filled gap in CME Group’s Bitcoin futures.
“Bitcoin has successfully found a support within the Daily CME Gap,” Rekt Capital observed.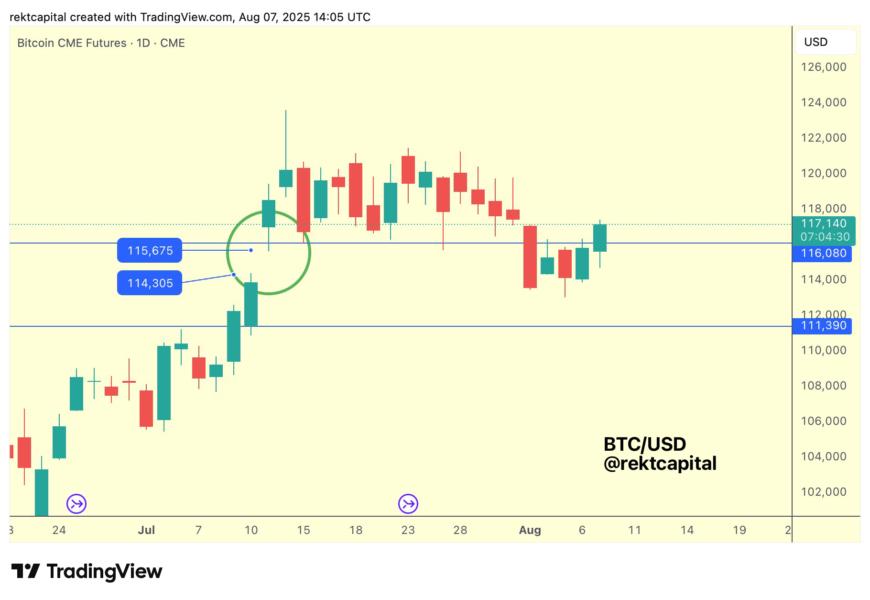
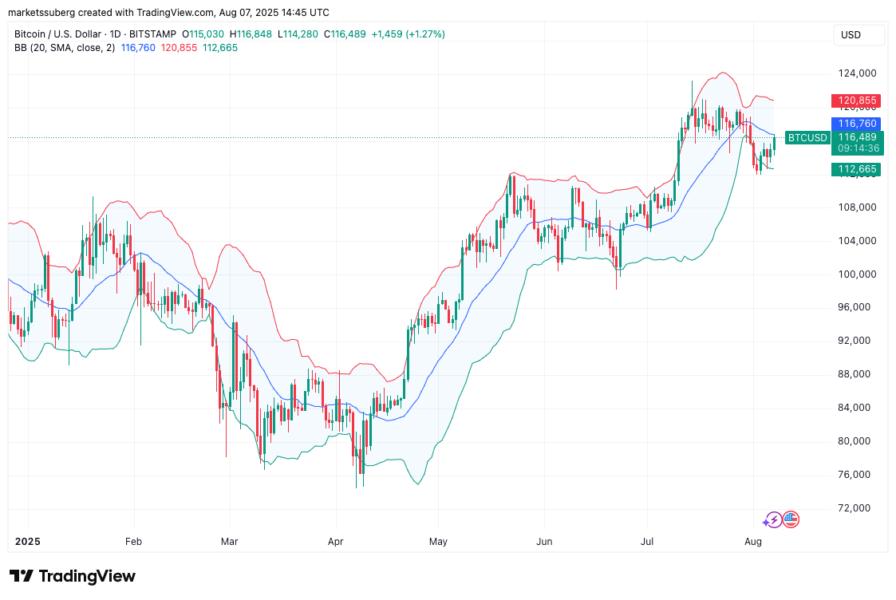
Bollinger Bands track fake BTC price breakdown
Price action nonetheless conformed to prescribed levels highlighted on the Bollinger Bands volatility indicator.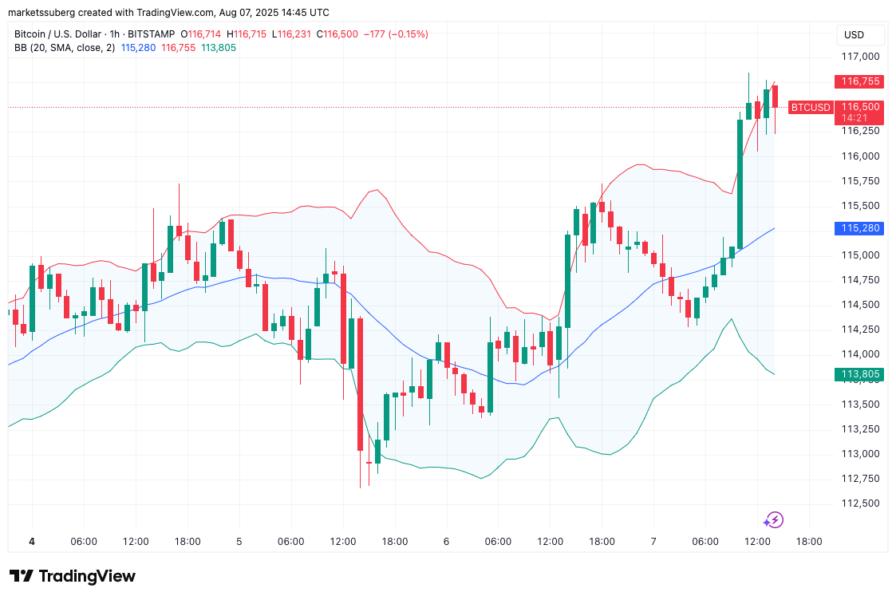
On hourly timeframes, price rejected at the upper band, while the daily chart delivered what creator John Bollinger described as a “head fake.”
Price dipped below the lower band before reversing, rejecting a breakdown in a similar style to previous swing lows in 2025.
“Bitcoin $BTCUSD and a number of the other cryptos are setting up a head fake after a Bollinger Band Squeeze. Interestingly, the pattern is not evident in the ETFs as they don't trade on weekends and holidays,” Bollinger noted on X.
“Analyst beware!”
This article does not contain investment advice or recommendations. Every investment and trading move involves risk, and readers should conduct their own research when making a decision.
Latest News
Cointelegraph
Aug 13, 2025 13:42:26
Cointelegraph
Aug 13, 2025 13:16:02
Cointelegraph
Aug 13, 2025 13:16:02
Cointelegraph
Aug 13, 2025 13:16:02
NewsBTC
Aug 13, 2025 13:08:59