Bitcoin Price Analysis: BTC Stabilizes After $15K Drop but Danger Still Looms
CryptoPotato
Aug 27, 2025 20:14:30


Bitcoin’s price has found support at a key level, but is still more likely to drop lower if underlying market dynamics don’t shift quickly. With the momentum also on the side of the sellers, buyers might be on the verge of capitulating.BTC Price: Technical Analysis
By ShayanThe Daily Chart
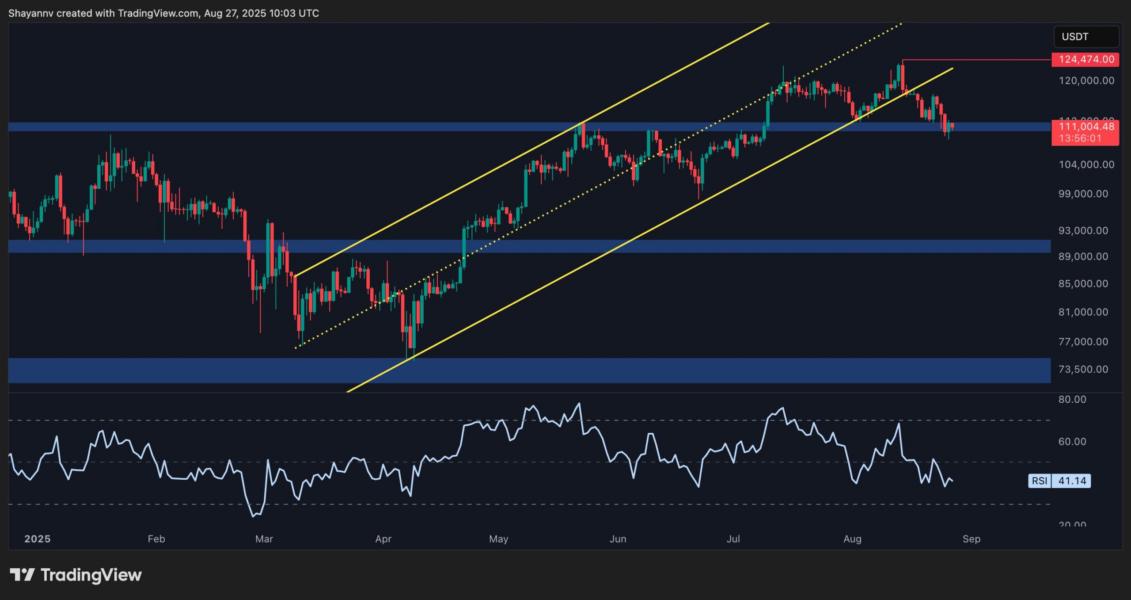
On the daily chart, the asset has made a new lower low after reversing above the $120K zone and breaking below the large ascending channel. The $110K area is currently providing support and halting the market’s short-term bearish trend. However, the price has still not demonstrated an impulsive rebound from this zone, which could point to a potential breakdown soon.
The RSI has also been below 50 for a while now, confirming the bearish momentum. This also adds to the probability of a deeper drop in the coming weeks, which could potentially drag the price as low as the $100K psychological support level.
This scenario would fail if the market shows a significant bounce from the $110K level soon, and the RSI also rises above 50 to indicate a bullish shift in momentum.
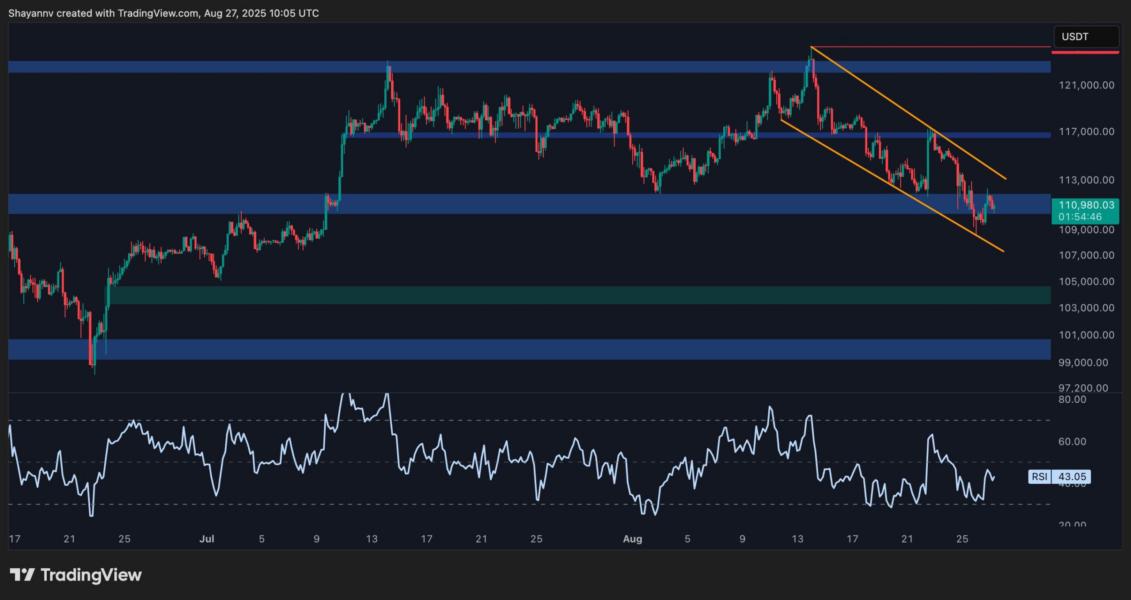
Looking at the 4-hour chart, it is evident that the price has been making lower highs and lows inside a steep descending channel, which has started since the latest all-time high. The price has also briefly broken below the $110K support level, before quickly rising again.
With the momentum also being bearish as indicated by the RSI, the price is more likely to either respect the channel and decline deeper, or even begin a short-term crash by breaking the channel to the downside. This could result in a move toward the $104K bullish fair value gap, or even a revisit of the $100K level if things get worse. Either way, BTC seems poised for more bearish price action, unless it breaks above the channel.
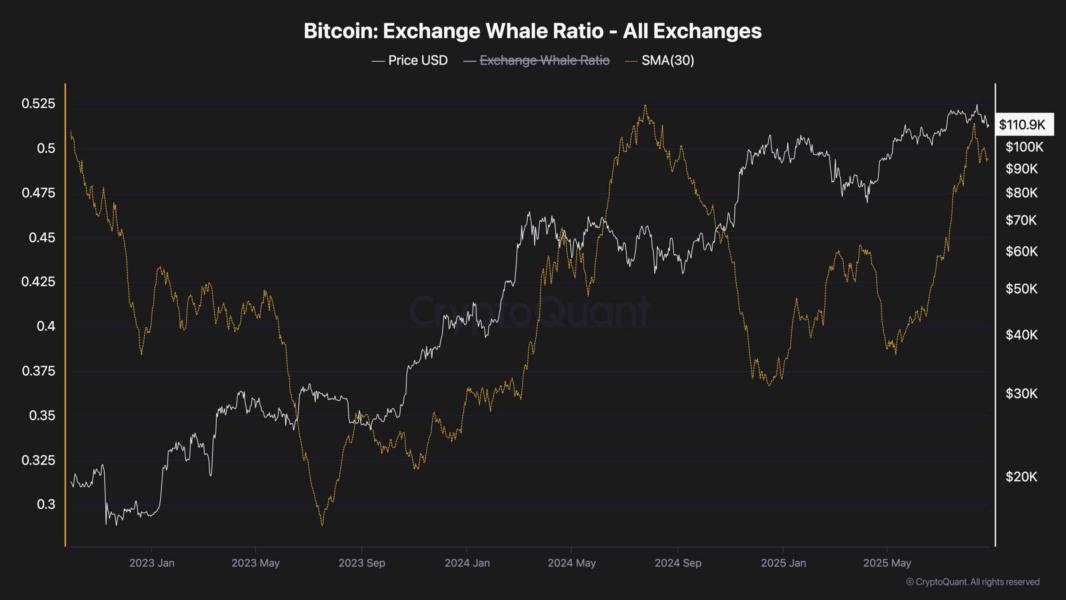
This chart highlights Bitcoin’s price action against the 100-day moving average of the Exchange Whale Ratio across all exchanges. The whale ratio represents the proportion of large inflows to exchanges coming from whales compared to overall inflows.
Historically, higher whale ratios indicate increased selling pressure since big players tend to move funds to exchanges before distribution.
In recent months, the whale ratio started a sharp rebound, moving higher alongside the latest price peak. This rise could signal a shift, with whales starting to exert more influence again, potentially preparing to offload positions. The signal points to a possible increase in short-term volatility if whale selling accelerates.
If the ratio continues climbing while Bitcoin hovers near $110K, the market might face stronger resistance and corrective moves.
Latest News
Coindar
Aug 28, 2025 02:59:10
Coindar
Aug 28, 2025 02:59:09
Cointelegraph
Aug 28, 2025 02:38:23
CryptoPotato
Aug 28, 2025 02:32:29
Beincrypto
Aug 28, 2025 01:43:19